
Chart Echo
Chart Echo instantly finds historical chart patterns matching your current setup and shows how they played out before, giving you data-driven.
Visit
About Chart Echo
Chart Echo is a powerful pattern recognition tool designed for traders and investors who want to make decisions based on historical precedent rather than guesswork. The platform automatically searches approximately 450 million historical windows across stocks and cryptocurrencies to find chart patterns that closely match the setup you are currently watching. Once matches are found, Chart Echo overlays those historical patterns directly onto your current chart in gold, allowing you to visually compare how similar formations have played out in the past. The tool then provides detailed outcome statistics, including how often similar setups rose, fell, or went nowhere, the average move following the pattern, and the typical drawdown experienced along the way. Chart Echo is built for active traders who want to validate setups before entering positions, long-term investors who need to sanity-check breakouts or sell-offs against decades of market data, and crypto watchers who understand that digital assets often repeat structural patterns. The platform is free to start with no account required, and it works across both desktop and mobile devices. It is important to note that Chart Echo does not provide predictions or financial advice. Instead, it organizes the market's own memory so you can study real precedent in seconds instead of manually scrolling through years of historical charts. The guided five-step workflow ensures that users can quickly move from selecting a market to reviewing matches, analyzing outcomes, and taking action.
Features of Chart Echo
Historical Pattern Matching
Chart Echo searches roughly 450 million historical windows across stocks and cryptocurrencies to find chart patterns that resemble your current setup. The matching algorithm analyzes the shape of your chart and identifies the most similar historical formations, ranking them by how closely they rhyme with your pattern. Each match comes with a similarity score and an explanation of why the patterns align, giving you confidence that the comparison is meaningful. This feature eliminates the need for manual chart scrolling and subjective pattern identification, replacing it with a data-driven approach that surfaces the most relevant historical analogs.
Outcome Statistics and Aggregation
Once historical matches are found, Chart Echo does not just show you the past patterns, it shows you what happened next. The platform aggregates the continuations from every matched historical window to produce honest, data-grounded statistics. You can see the probability of a rise, fall, or sideways movement, the average expected move, and the typical drawdown along the way. This statistical aggregation provides a clear picture of the odds associated with your current setup, helping you make more informed decisions based on actual market behavior rather than emotional reactions or anecdotal evidence.
Gold Overlay Visualization
Chart Echo overlays each historical match directly onto your live chart using a distinctive gold color. This visual overlay allows you to see exactly how the past pattern aligns with your current setup, making it easy to spot similarities and differences at a glance. The overlay is interactive, letting you toggle between different matches and adjust the view to focus on specific timeframes or price levels. This feature bridges the gap between abstract statistics and visual analysis, giving you a concrete reference point for understanding how your current chart has behaved in similar historical contexts.
Guided Five-Step Workflow
The platform provides a structured, guided workflow that takes you from selecting a market to taking action in five clear steps. First, you pick the stock or crypto you are watching. Second, you set the timeframe and define how many candles constitute the pattern. Third, you review a ranked list of historical matches with similarity scores. Fourth, you overlay a match on your live chart and examine the outcome statistics. Fifth, you can save the workspace, set a reminder for future fractals, or share a Story GIF. This guided approach removes the complexity and guesswork, ensuring that even new users can quickly leverage the power of historical pattern matching.
Use Cases of Chart Echo
Validating Active Trading Setups
Active traders can use Chart Echo to validate their setups before committing capital. Before entering a trade based on a breakout, reversal, or continuation pattern, traders can search for historical analogs to see how similar setups resolved over the following days and weeks. The outcome statistics provide objective data on success rates, average moves, and typical drawdowns, helping traders set realistic profit targets and stop-loss levels. This use case transforms subjective pattern recognition into a data-backed decision-making process, reducing reliance on gut feelings and increasing confidence in trade selection.
Sanity-Checking Long-Term Investment Decisions
Long-term investors can use Chart Echo to sanity-check breakouts, sell-offs, or consolidation phases against decades of historical precedent. Instead of relying on a single analyst's opinion or media narrative, investors can see how similar chart structures have played out across multiple historical instances. For example, if a stock breaks out from a multi-year base, Chart Echo can show how similar breakouts performed in the past, including the typical pullback depth and duration. This context helps investors distinguish between genuine structural moves and temporary noise, leading to more disciplined portfolio management.
Analyzing Cryptocurrency Market Rhythms
Crypto traders and investors can leverage Chart Echo to analyze the repetitive nature of cryptocurrency markets. Digital assets like Bitcoin, Ethereum, and other major cryptocurrencies often exhibit strong structural rhymes, with patterns repeating across different market cycles. Chart Echo allows users to match current crypto setups against their own historical data and across different assets. This cross-asset matching can reveal when a pattern in one crypto has previously appeared in another, providing valuable insights into potential future behavior. The tool is particularly useful for identifying blow-off tops, capitulation lows, and base breakouts in the volatile crypto space.
Educational Study of Market Patterns
Students and self-taught traders can use Chart Echo as an educational tool to study how chart patterns actually perform in real markets. Instead of learning pattern recognition from textbooks or idealized examples, users can explore thousands of real historical instances to understand the variability and probability of outcomes. The platform makes it easy to see that not every cup-and-handle or head-and-shoulders pattern resolves the same way, teaching users to think in terms of probabilities and ranges rather than certainties. This use case builds a more realistic and practical understanding of technical analysis that directly translates to better trading decisions.
Frequently Asked Questions
How does Chart Echo find historical matches?
Chart Echo uses a proprietary fractal matching algorithm that analyzes the shape of your current chart and searches approximately 450 million historical windows across stocks and cryptocurrencies. The algorithm compares the geometric structure of price action, not just indicators or oscillators, to find the closest historical analogs. Each match is assigned a similarity score based on how closely the historical pattern aligns with your current setup. The platform then ranks these matches so you can focus on the most relevant historical precedents.
Is Chart Echo a prediction tool or financial advice?
No, Chart Echo is explicitly not a prediction tool and does not provide financial advice. The platform is designed to organize and present historical market data so that users can study precedent and make their own informed decisions. The outcome statistics show what happened in the past for similar patterns, but past performance does not guarantee future results. Chart Echo encourages users to combine its historical insights with their own analysis, risk management strategies, and understanding of current market conditions before making any trading or investment decisions.
What markets and timeframes does Chart Echo support?
Chart Echo supports both stocks and cryptocurrencies, covering a broad range of popular assets. Users can search for any stock or crypto ticker to begin their analysis. The platform allows you to set the timeframe and define how many candles constitute the pattern you are analyzing. Free users have access to standard timeframes, while Premium subscribers unlock intraday timeframes for more granular analysis. The historical database includes decades of data, enabling matches across different market cycles and conditions.
Can I save my workspaces and set up alerts?
Yes, accounts on Chart Echo unlock the ability to save workspaces, allowing you to return to your analysis later without redoing the search. Additionally, users can set up reminders to be notified when their favorite chart prints a strong fractal projection. Premium subscribers gain access to saved-setup reminders and alerts for when new matches appear. These features help you stay on top of evolving patterns without constantly monitoring the platform, making it easier to integrate Chart Echo into your regular trading routine.
Similar to Chart Echo

Polymarket Trading Bot For Crypto
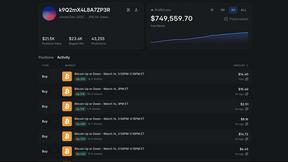
This Polymarket trading bot automates high-frequency arbitrage and directional strategies on 5-15 minute crypto up or down markets.